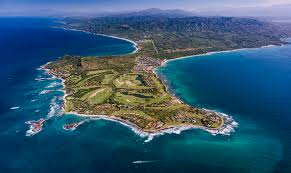
Live pricing, price-per-m² by zone, development benchmarks and inventory — drawn directly from 3,888 active MLS listings across the bay.
$3,819
Median USD / m²
$453K
Median price (USD)
3,888
Active listings
The price, inventory and $/m² figures are recomputed from the MLS feed several times a day from the listings active right now (last updated August 14, 2026). They are asking prices, not closed sales.
So from one day to the next, the active-listing count, the median price and the median $/m² can move as properties come on, get repriced, or sell and drop off. Don't be surprised if tomorrow's number differs slightly — that's the market, not an error.
Two exceptions are fixed, not live: the short-term-rental section is a 2025 snapshot, and the SHF appreciation figure is an official quarterly index.
Financing the bay's median $453K home at today's 6.66% U.S. rate runs about $2,913/month and roughly $595K in interest over 30 years — a cash purchase in Mexico skips it entirely.
At Jalisco's official 7.7% real annual appreciation (SHF index, inflation-adjusted), that same $453K median home would add about $35K in real value in a year — well above the 3.9% national average.
The bay spans a 1.7× price gap: Lower Conchas Chinas leads at $7,066/m², while Bucerías — the most active market with 448 active listings — offers value at $4,100/m².
Oceanfront commands a premium: among active beachfront developments, Harbor 171 leads at $7,000/m², while Bay View Grand offers the best-value beachfront at $4,742/m².
Rental demand is highly seasonal: across 16,449 short-term rentals, occupancy swings from 90% in February to 36% in September at about $165/night — investors should model a calendar, not a flat number.
Median price
$8.3M
≈ $453K USD
Median $/m²
$3,819
USD / m²
Active listings
3,888
condos · houses · land
Price range
$738K – $720M
MXN
As of this report, there are 3888 active for-sale listings in Puerto Vallarta & Riviera Nayarit across condos, houses and land. The median asking price is $8,306,500 MXN (≈ $453K USD), with the market ranging from $738,000 MXN on the entry end up to $720,000,000 MXN at the top. The median price per square meter is about $3,819 USD/m², a useful yardstick when comparing value between buildings.
Condos lead the Puerto Vallarta & Riviera Nayarit market with 2731 active listings at a median of $8,250,000 MXN (≈ $4,083 USD/m²). Roughly 23% of current inventory advertises an ocean, bay or water view. The typical property was built around 2025, so buyers see a mix of newer developments and established residences.
On a per-development basis, Flamingos Paradise is among the most active in Puerto Vallarta & Riviera Nayarit with 88 listings, a median of $6,596,582 MXN and entry pricing from $3,891,681 MXN (≈ $3,662 USD/m²).
“Comparing $/m² across developments is the fastest way to spot where your money buys more.
Mexico's official home-price index (Sociedad Hipotecaria Federal) tracks appreciation of mortgaged homes nationwide. SHF doesn't break out Puerto Vallarta or Bahía de Banderas as its own metro, so the two states that hold the bay — Nayarit and Jalisco — are the closest sanctioned benchmark. Figures shown are real (inflation-adjusted, deflated by 4.59% annual CPI), alongside the bay's live asking prices below.
+3.9%
National · real YoY
8.7% nominal
+6.9%
Nayarit · real YoY
Riviera Nayarit / Bahía de Banderas · 11.8% nominal
+7.7%
Jalisco · real YoY
Puerto Vallarta · 12.6% nominal
$2.0M
National avg. price
Source: Índice SHF de Precios de la Vivienda, Sociedad Hipotecaria Federal (Q1 2026)
Why buyers move now: with U.S. mortgage rates elevated, cash purchases in Mexico stretch further — and every move in the peso changes a foreign buyer's entry price.
6.66%
U.S. 30-yr mortgage
$17.33
USD / MXN
$12.35
CAD / MXN
Sources: Freddie Mac / FRED · Banxico
How many active listings fall in each price band (MXN).
Median price per square meter (USD) in the most active developments — where your money buys more.
Every number above comes from active MLS inventory. Browse the actual homes, or let HOMIA flag the best-value deals for you.
Figures are computed directly from active MLS listings across Puerto Vallarta and Riviera Nayarit as of Q3 2026, covering condos, houses and land at or above the market entry threshold. All values are median asking prices (not closed sales); price per m² is derived per listing then aggregated. USD figures use the listing's native currency where available. Official appreciation figures come from Mexico's SHF House Price Index. HOMIA is an AMPI-member brokerage and updates this report quarterly.
Cite this report as
HOMIA Puerto Vallarta & Riviera Nayarit Real Estate Market Report, Q3 2026. homia.mx.
Journalists & researchers: for custom data pulls, zone-level breakdowns or an on-record quote, contact info@homia.mx.
Data reflects active MLS listings and is refreshed regularly. Figures are asking prices, not closed sales.
Median price per square meter (USD) among active beachfront developments — where oceanfront commands a premium.
Median asking price per square meter (USD) across the bay's active zones — the fastest read on where value sits. Bars run priciest to best-value; the dashed line marks the bay-wide median. Tap any zone for its full market study.
Bay median$3,819


Airbnb performance across 16,449 active listings, crossed with MLS asking prices. Gross yield varies sharply by zone — rental-grade neighborhoods lead, so the per-zone table below is where the real number lives.
$259K
Median annual revenue
54%
Median occupancy
$3K
Median nightly rate
6.8%
Top-zone gross yield · Punta de Mita
Occupancy by month (%)
| Zone | Annual rev. | Occ. | Gross yield |
|---|---|---|---|
Punta de Mita | $749K | 51% | 6.8% |
Amapas | $577K | 63% | 4.8% |
Romantic Zone | $379K | 62% | 3.9% |
Upper Conchas Chinas | $670K | 62% | 3.9% |
Rental figures: 2025 Airbnb performance (16,449 geolocated active listings, MXN, gross). Gross yield = median annual rental revenue ÷ MLS median asking price — before costs, fees and vacancy. A benchmark, not a guarantee.
| Type | # | Median | $/m² |
|---|---|---|---|
| Condos | 2731 | $8.3M | $4,083 |
| Houses | 728 | $11M | — |
| Land | 429 | $4.4M | $421 |
| Bedrooms | # | Median price |
|---|---|---|
| 1 bd | 620 | $6.6M |
| 2 bd | 1547 | $8.3M |
| 3 bd | 674 | $12M |
| 4+ bd | 432 | $19M |
Ocean / bay view
23%
of active inventory
Median year built
2025
Avg. price
$12M
MXN
Median days on market
235
days
Offer financing
12%
developer / owner

| $322K |
| 53% |
| 3.5% |
La Cruz de Huanacaxtle | $257K | 46% | 3.3% |
Lower Conchas Chinas | $670K | 62% | 3.2% |
Flamingos | $227K | 46% | 3.2% |
Bucerías | $212K | 49% | 2.6% |
Marina Vallarta | $222K | 52% | 2.5% |
Sayulita | $322K | 56% | 2.4% |
Versalles | $149K | 54% | 2.3% |
Alta Vista | $207K | 55% | 2% |
5 de Diciembre | $147K | 53% | 1.5% |